
Ofgem’s energy price cap page publishes figures for successive three-month periods. Its October–December 2026 headline annual cost is the benchmark for a decision due before the January–March 2027 cap takes effect. The question matters to households planning winter costs, but the answer will depend on Ofgem’s next published figure. This forecast closes on 31 October 2026, before that figure is expected; it does not predict what any individual household will pay.
The October–December pound amount has not been independently verified for this report, so no number is quoted here. Readers can check the current headline figure on Ofgem’s page. The comparison must use the same payment method and typical household definition for both periods.
The forecast question and deadline
Will Ofgem’s published headline annual cost for a typical dual-fuel household paying by Direct Debit be lower in January–March 2027 than in October–December 2026? The comparison is between Ofgem’s figures for those two periods, using its matching typical household definition and payment method. The forecast closes on 31 October 2026.
- YES if the January–March 2027 figure is lower than the October–December 2026 figure.
- NO if the January–March figure is equal to or higher than the October–December figure.
- Ofgem’s energy price cap page supplies the published figures that settle the question.
A difference of even £1 in the headline annual cost would count as a fall under this rule. An unchanged figure would count as NO. The question concerns the published cap comparison, not whether a particular household’s next bill decreases.
Why the October–December figure is the benchmark
Ofgem sets a price cap for each three-month period. That makes the October–December 2026 figure the immediate predecessor of the January–March 2027 figure. Comparing those successive periods gives the forecast a clear public test: one published annualised headline cost against the next.
The figures need to be read on the same basis. Ofgem may show different headline amounts for different payment methods or household examples. Comparing a Direct Debit amount for one period with a different payment method for the other could produce an apparent rise or fall that does not answer this question.
The same care applies to the household definition. This forecast uses Ofgem’s typical dual-fuel household example for both periods. If Ofgem changes how it presents that example, the comparison must identify matching figures before declaring a result. A number taken from a supplier’s advertisement, a forecast from another organisation or an individual bill would not replace Ofgem’s published headline amounts.
What the cap does to a household bill
The energy price cap limits the unit rates and standing charges a supplier can charge customers covered by it. A unit rate is the price for each unit of gas or electricity used. A standing charge is a daily charge that applies regardless of how much energy the household consumes. Ofgem’s headline annual cost illustrates those capped charges for a typical level of use.
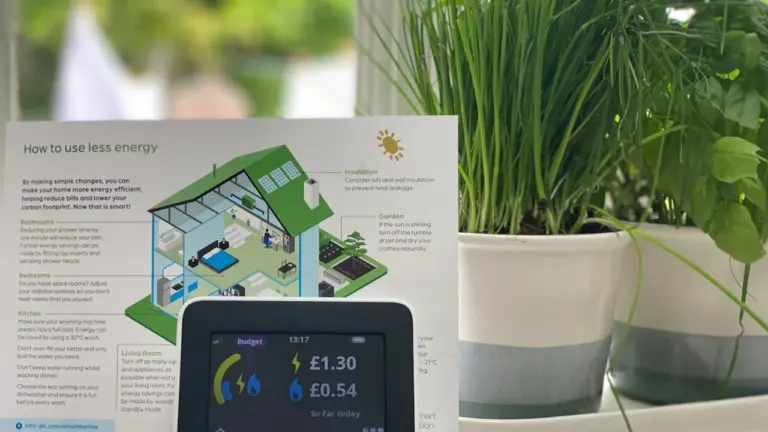
That annual figure is a comparison tool, not a fixed bill or a limit on the total a household can spend. A home that uses more energy than the typical example can pay more than the headline amount. A home that uses less can pay less. The number of days covered by a bill, the household’s meter readings and its supplier’s applicable rates also affect the amount due.
For example, a lower January–March headline figure would settle this forecast as YES, yet a household might still receive a larger bill than it did in autumn. Winter heating can increase gas use enough to outweigh a lower rate. Equally, a NO result would not mean every household’s bill must rise: reduced use could lower an individual bill even if the published headline cap stayed level or increased.

What could produce a YES or NO result
A YES result requires a lower January–March 2027 headline annual cost on the specified Direct Debit and typical household basis. It would indicate that the capped rates, taken together in Ofgem’s example, produce a smaller annualised amount than the October–December 2026 benchmark. It would not establish how much any one customer will save.
A NO result covers two possibilities: Ofgem publishes exactly the same headline amount, or it publishes a higher one. The rule is deliberately strict about equality. A figure that does not fall cannot be described as a fall, even if one component of the cap, such as a unit rate, moves down while another moves up.
Both outcomes remain possible until Ofgem publishes the January–March figure. The current price cap describes the preceding period; it does not settle the next one. Estimates released before Ofgem’s decision may help households plan, but they are forecasts. This question is resolved by the published Ofgem comparison.
Check the published figures on the same basis
When the January–March 2027 cap is published, locate Ofgem’s headline annual cost for a typical dual-fuel household paying by Direct Debit. Then find the equivalent October–December 2026 amount. Compare the two pound figures without switching payment methods or household examples. The result follows directly from which number is lower.
The relevant date is the cap period, not the day a news report or supplier email appears. Ofgem’s January–March figure may be announced before 1 January, but it applies to that later period. The 31 October 2026 close keeps the forecast decision ahead of the expected publication of the result; the public result itself comes from Ofgem when it releases the new cap.
Readers should also check whether their account is on a tariff covered by the cap. A fixed deal has its own agreed prices, and a supplier’s communication should explain which rates apply to the account. The headline cap is useful context, but the supplier’s actual unit rates and standing charges are the figures needed for a personal estimate.
Turn the announcement into a useful bill estimate
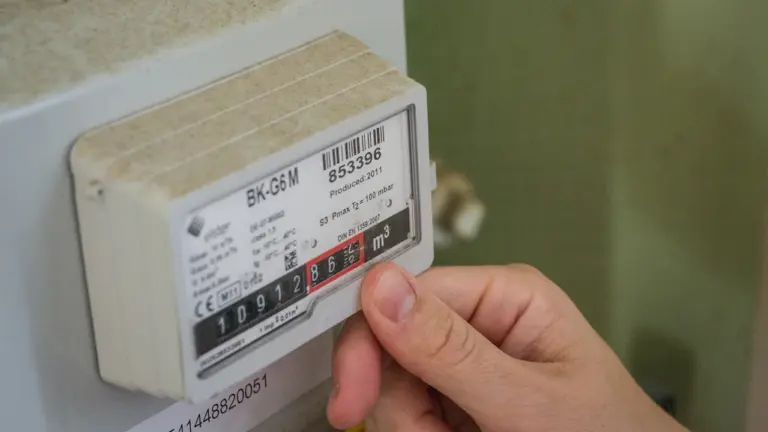
Once the new cap is published, compare the electricity and gas unit rates and standing charges shown by your supplier with those on your current tariff. Use recent meter readings or an account statement to estimate your likely winter consumption. Multiplying expected use by the relevant unit rates, then adding standing charges for the billing days, gives a more useful estimate than treating Ofgem’s typical annual cost as your bill.
A household that expects a change in occupancy, heating habits or time spent at home should account for that change. Comparing two unusually different billing periods without checking usage can make a rate change look larger or smaller than it is. Direct Debit payments may also be smoothed across the year, so a changed monthly payment does not by itself show what the new cap costs for the energy consumed that month.
The next decisive check is Ofgem’s January–March 2027 headline figure beside its October–December 2026 figure. For household planning, follow that comparison with your supplier’s published rates and your own estimated usage.
Source: Ofgem
Context & actions About this article
Source check How this forecast is decided
The result depends on whether Ofgem’s January–March 2027 headline annual cost is lower than its October–December 2026 cost on the same Direct Debit and typical household basis.
- Read Ofgem’s headline annual cost for October–December 2026.
- Read the matching January–March 2027 figure when published.
- Check that both figures use Direct Debit and the same typical dual-fuel household definiti...
- Source
- Ofgem energy price cap
- Scope
- United Kingdom
- Updated
- 2026-09-29 10:10
Source check
Report a trust issue
Send a clear signal to community moderation if the source, facts or context need review.

Comments